A Texas Truck Accident Lawyer research report for Thanksgiving 2026
Research checked November 6, 2026. Historical records, not a forecast.
Holiday traffic advice usually focuses on beating the backup. Our review asks a different question: what happens during the hours travelers may choose to avoid it?
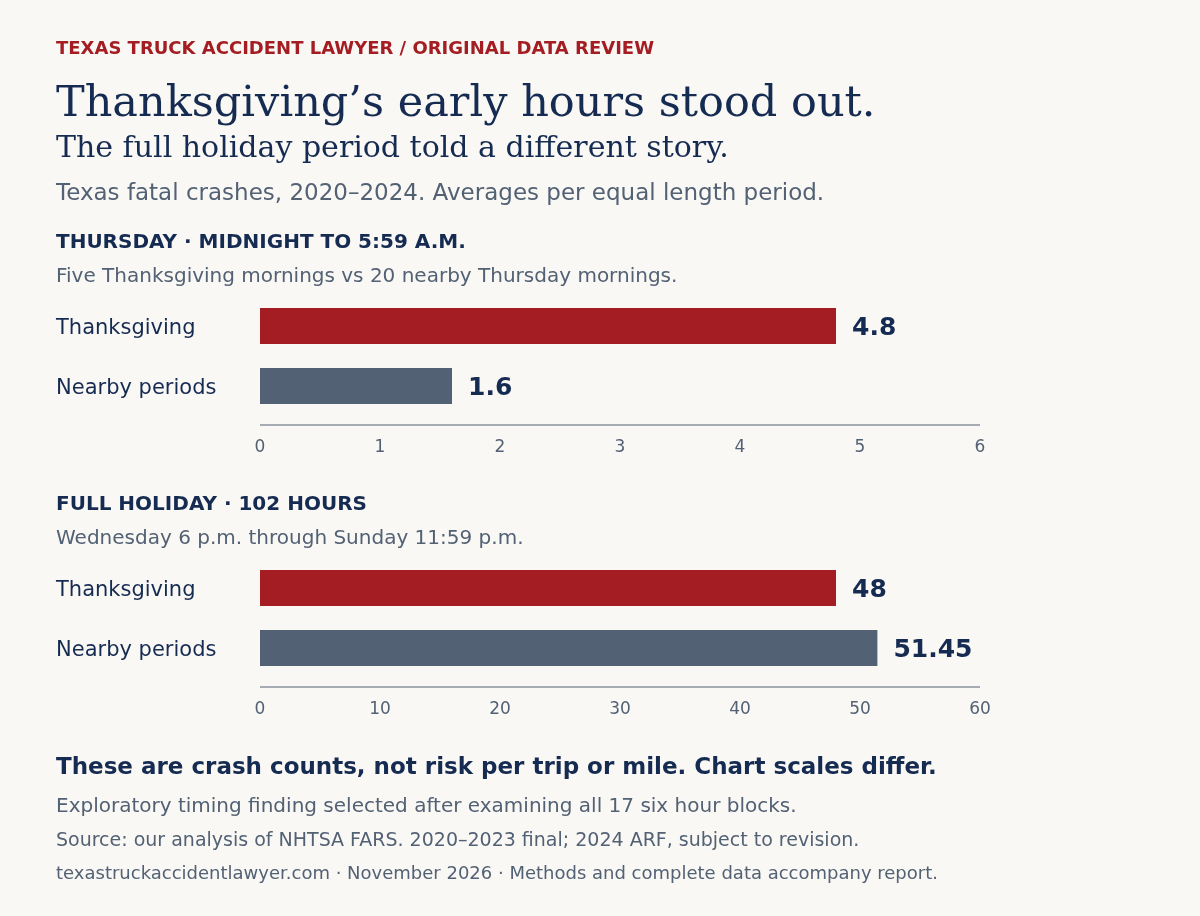
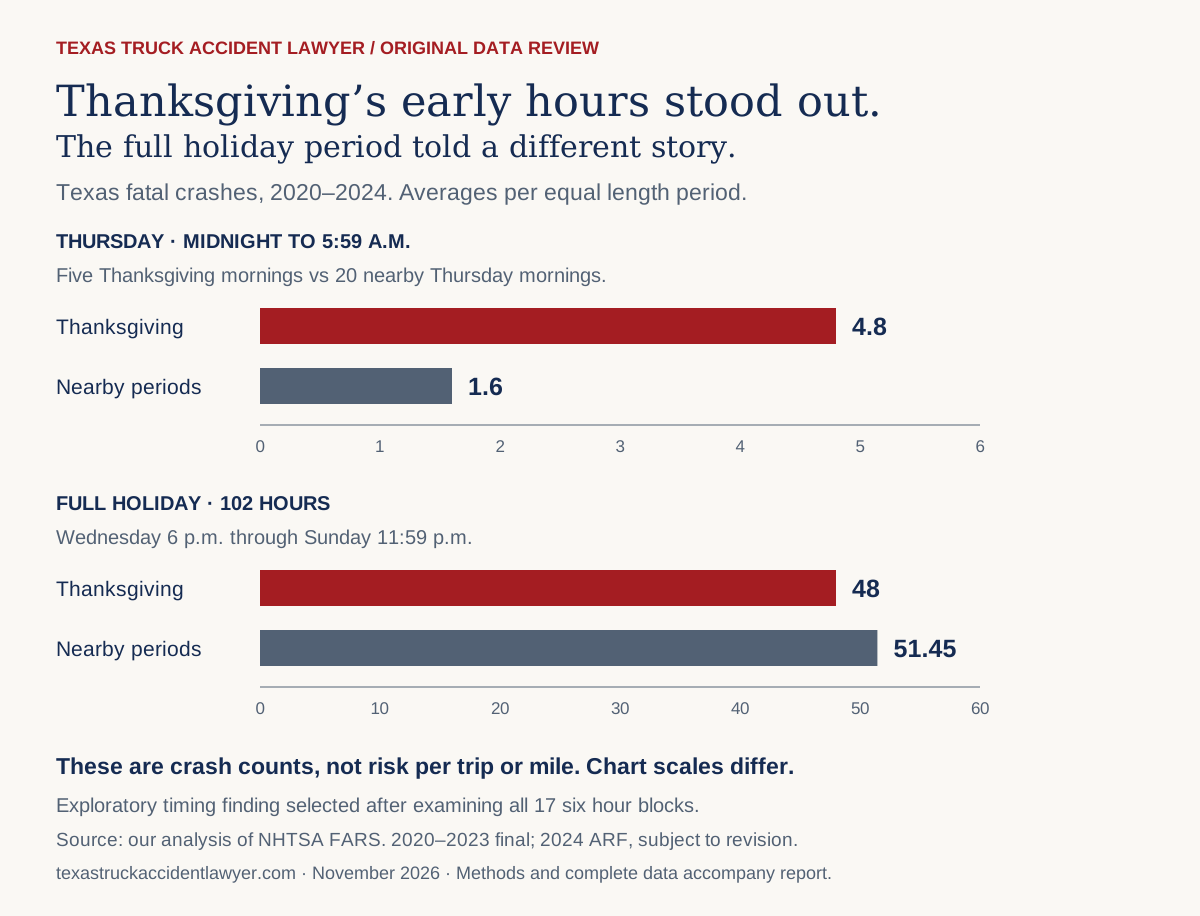
Across five Thanksgivings, Texas recorded 24 fatal crashes between midnight and 5:59 a.m. on Thanksgiving Thursday. That averaged 4.8 crashes per six hour period, compared with 1.6 during the same hours on nearby Thursdays. The comparison covers 2020 through 2024 and uses federal fatal crash records.
That is three times the average crash count, not three times the risk for an individual traveler. We did not have a matching measure of trips or miles traveled. The distinction matters when deciding whether to leave late at night just to miss traffic.
At Texas Truck Accident Lawyer, we reviewed the full holiday period, not only the hours that produced the largest difference. The overall result points in a different direction: the Thanksgiving periods averaged fewer fatal crashes than the nearby comparison periods. Both findings belong in the story.
The hours before Thanksgiving dinner stood out
We divided the official holiday window into six hour blocks, starting Wednesday at 6 p.m. and ending at 11:59 p.m. Sunday. The largest relative increase in fatal crash counts appeared on Thursday from midnight through 5:59 a.m.
This was not a comparison between Thanksgiving night and an ordinary afternoon. We matched Thursday with Thursday, using the same reported FARS hours one and two weeks before and after the holiday in each year.
| Year | Thanksgiving Thursday, midnight to 5:59 a.m. | Average of four nearby Thursdays, same hours |
|---|---|---|
| 2020 | 5 fatal crashes | 1.75 |
| 2021 | 7 | 2.25 |
| 2022 | 3 | 2.50 |
| 2023 | 4 | 0.75 |
| 2024* | 5 | 0.75 |
| Average | 4.8 | 1.6 |
2024 uses NHTSA's Annual Report File, which is subject to revision. The 2020 through 2023 files are final versions. Counts describe all Texas road users in fatal crashes, not just car occupants or trucks.
The Thanksgiving count was above that year's four comparison period average in each of the five years. Those 24 crashes killed 27 people. The underlying numbers are small, so one crash can noticeably change a year's comparison.
We also checked whether one unusual year explained the pooled result. Removing each year in turn left the count ratio between 2.62 and 3.82. Removing 2020 left a ratio of 3.04. Using only the immediately preceding and following Thursdays produced the same pooled ratio of 3.00.
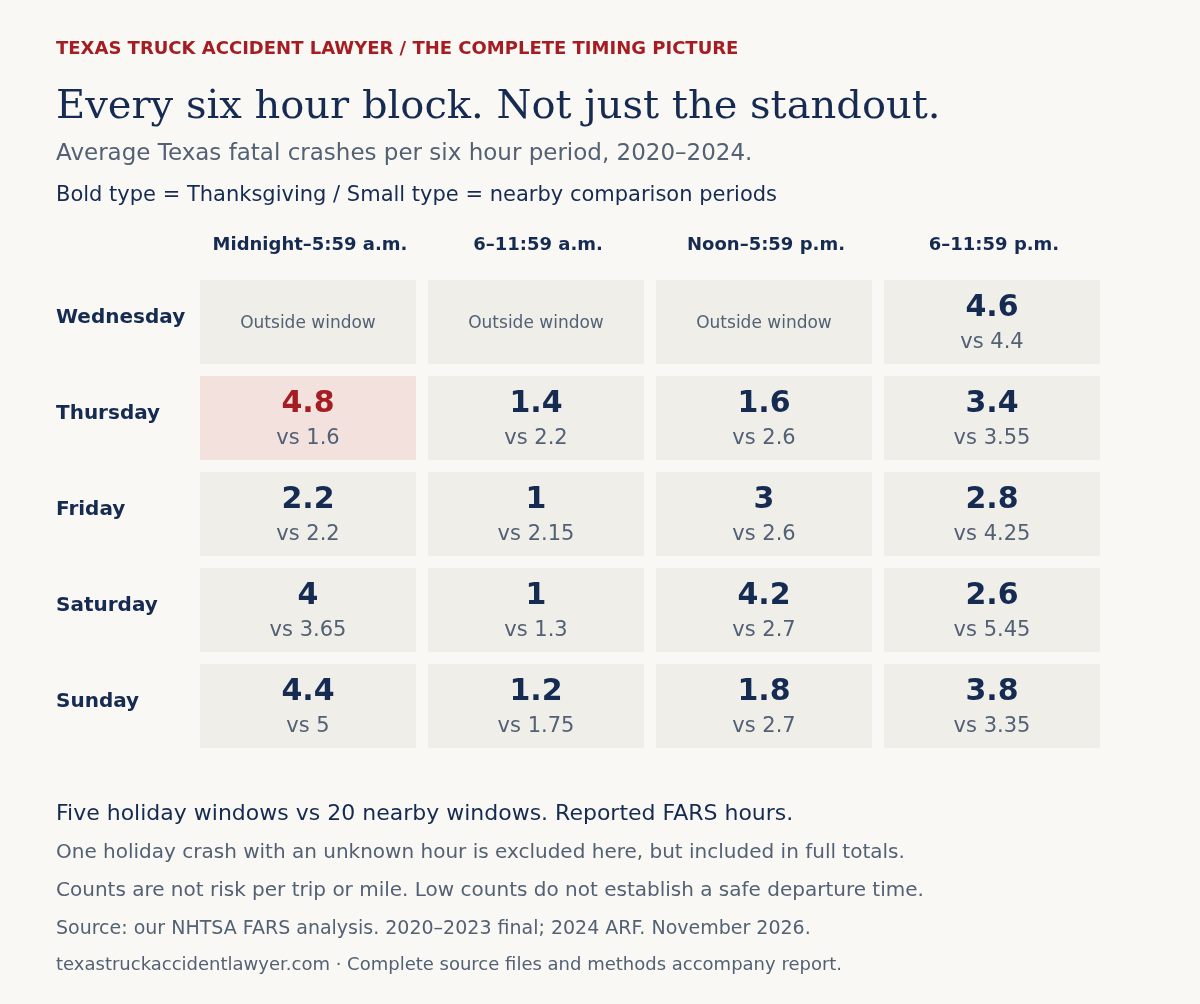
Those checks help describe the pattern. They do not prove a cause, establish statistical significance or predict what will happen this Thanksgiving. We selected this finding after examining all 17 six hour blocks. The complete comparison is included with the report, rather than hiding the other results.
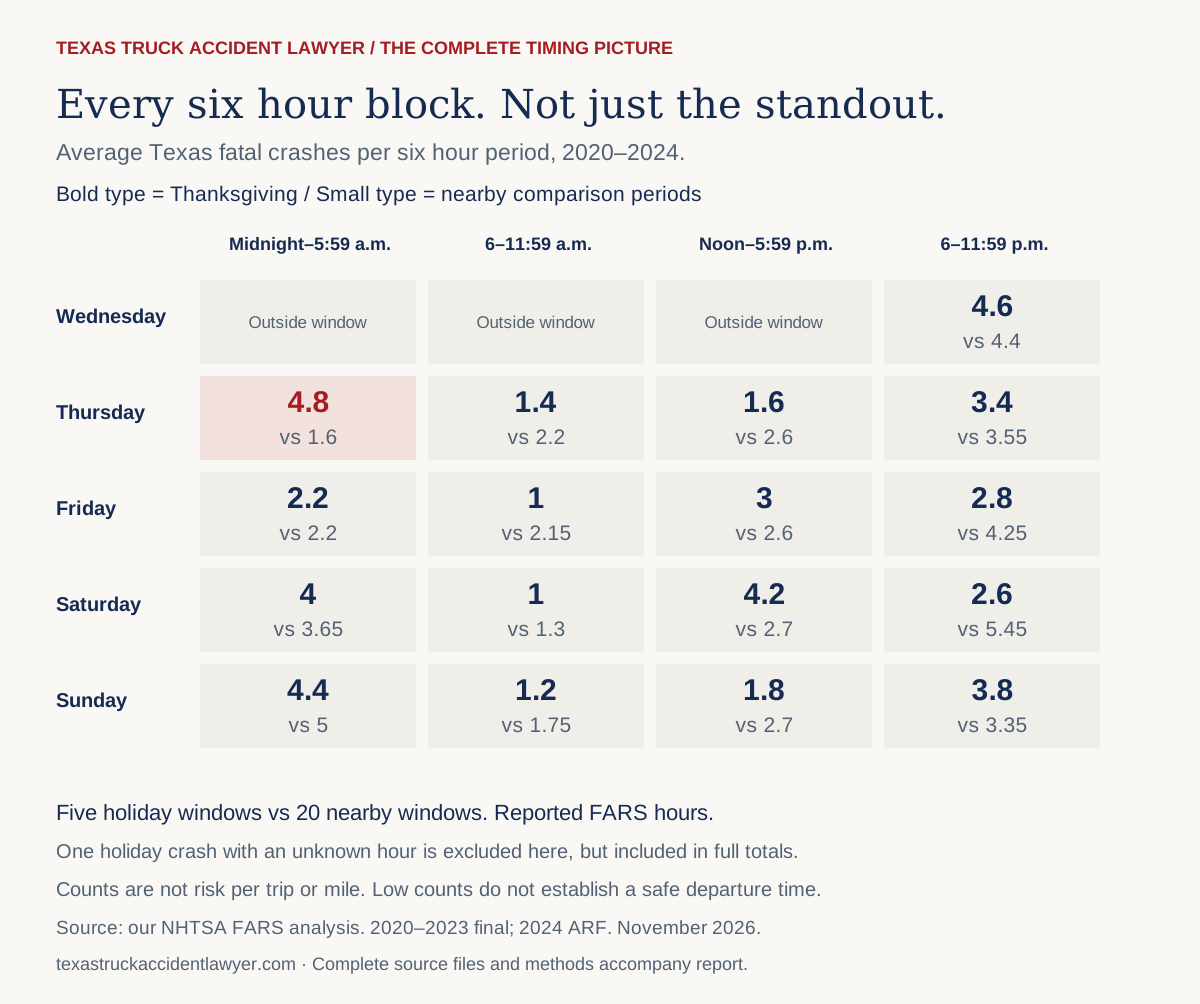
| Day | Reported hours | Thanksgiving | Nearby periods |
|---|---|---|---|
| Wednesday | 18:00–23:59 | 4.6 | 4.4 |
| Thursday | 00:00–05:59 | 4.8 | 1.6 |
| Thursday | 06:00–11:59 | 1.4 | 2.2 |
| Thursday | 12:00–17:59 | 1.6 | 2.6 |
| Thursday | 18:00–23:59 | 3.4 | 3.55 |
| Friday | 00:00–05:59 | 2.2 | 2.2 |
| Friday | 06:00–11:59 | 1 | 2.15 |
| Friday | 12:00–17:59 | 3 | 2.6 |
| Friday | 18:00–23:59 | 2.8 | 4.25 |
| Saturday | 00:00–05:59 | 4 | 3.65 |
| Saturday | 06:00–11:59 | 1 | 1.3 |
| Saturday | 12:00–17:59 | 4.2 | 2.7 |
| Saturday | 18:00–23:59 | 2.6 | 5.45 |
| Sunday | 00:00–05:59 | 4.4 | 5 |
| Sunday | 06:00–11:59 | 1.2 | 1.75 |
| Sunday | 12:00–17:59 | 1.8 | 2.7 |
| Sunday | 18:00–23:59 | 3.8 | 3.35 |
The whole weekend does not show the same increase
A dramatic overnight finding should not become a claim that every Thanksgiving trip is more dangerous.
Across the full 102 hour periods in 2020 through 2024, our FARS analysis counted 240 fatal crashes and 273 deaths in Texas. Across the 20 nearby comparison periods, it counted 1,029 fatal crashes and 1,148 deaths.
There were four times as many comparison periods, so raw totals are not comparable. On an equal period basis:
| Measure | Average Thanksgiving period | Average nearby comparison period |
|---|---|---|
| Fatal crashes | 48.00 | 51.45 |
| People killed | 54.60 | 57.40 |
The holiday fatal crash count was 6.7% lower on average. That is not evidence that Thanksgiving travel is safer per mile. Traffic volume, weather, travel purpose and the people using the roads may differ. The small overall difference in deaths also changes direction in some sensitivity checks, so we are not presenting a reliable holiday safety advantage.
The National Safety Council already compares Thanksgiving with nearby periods nationally. Our contribution is the Texas breakdown by day and time, with a published comparison set and checks across years. We are not claiming to have invented matched period analysis or to be the only publisher discussing Thanksgiving safety.
The latest Texas holiday totals, kept separate
TxDOT's newer state tables include Thanksgiving 2025. Over its five holiday periods from 2021 through 2025, the agency reports 215 fatal crashes and 236 deaths. The 2025 period alone had 39 fatal crashes and 41 deaths.
These figures are state context, not extra observations added to the federal comparison. We did not have a 2025 FARS file for the detailed analysis. TxDOT's 2021 through 2024 tables carry an April 9, 2025 processing date. Its 2025 table carries an April 7, 2026 processing date.
There is also a source difference worth making visible. For Thanksgiving 2024, the FARS file used here has 36 fatal crashes and 40 deaths. TxDOT's published holiday table has 35 and 39. We have not established why the records differ. We preserve each source's figures and do not combine them into one denominator.
What this means for your travel plans
Do not choose an overnight departure solely because the road may be less crowded. A congestion forecast estimates delay. This report counts historical fatal crashes. Neither gives the probability of a crash on your particular trip.
NHTSA advises avoiding peak sleepiness periods, including midnight to 6 a.m. and late afternoon, when possible. Our timing finding overlaps one of those periods, but our analysis does not establish that fatigue caused the crashes we counted. We also did not establish that alcohol, holiday parties or commercial traffic explains the difference.
Before committing to a departure time, decide who will be rested enough for the entire journey, where a tired driver can stop safely and whether staying overnight is an option. A shorter queue is not a good reason to replace sleep with more time behind the wheel. Plan a sober ride before drinking, rather than relying on finding one at the last minute.
Give the return journey the same attention. Check current conditions on the official Texas travel map before leaving. Historical counts cannot tell you whether a route is clear, flooded, closed or affected by a crash today. Do not treat an old highway ranking as an instruction to take an unfamiliar alternate route.
These precautions do not decide responsibility after a collision. An injured person can follow sensible advice and still be harmed by another driver's conduct. We would examine the evidence of the particular crash rather than assigning fault from the date, the hour or a statewide statistic.
What the truck data can and cannot say
Our guide to federal trucking regulations explains the separate rules that apply to commercial drivers. The main findings above concern all fatal crashes. They must not be described as truck crash figures.
Using NHTSA's large truck involvement flag, the full Thanksgiving periods contained 31 fatal crashes involving a large truck, with 34 people killed. That is an average of 6.2 crashes per holiday period, compared with 7.9 in nearby comparison periods. This does not support a claim of more truck involved fatal crashes across the full holiday window.
We checked the federal classification against NHTSA's published national large truck vehicle totals in every year. All five matched. A commercial motor vehicle is not necessarily a large truck, and a crash involving a truck is not automatically a crash caused by its driver. The death count includes everyone killed in those crashes, not only truck occupants.
For reproduction, the crash flag is ACC_AUX.A_LT = 1, joined by year and case number. The flagged case sets matched those obtained from VEH_AUX.A_BODY = 6. Classification labels come from NHTSA's auxiliary formats, and annual vehicle totals were checked against Table 1 of Large Trucks: 2024 Data.
How we did the analysis
Sources and versions. We used the NHTSA Fatality Analysis Reporting System national accident files for 2020 through 2024, selecting Texas with STATE code 48. These are the latest five detailed years collected for this analysis. Release notes identify 2020 through 2023 as final and 2024 as an Annual Report File. FARS covers qualifying fatal traffic crashes, not all injury or property damage crashes. We used separate TxDOT holiday tables for the newer state totals.
Holiday window. Each Thanksgiving window starts at 6 p.m. on the Wednesday before the fourth Thursday in November and ends at 11:59 p.m. Sunday: 102 hours. Wednesday contributes only six hours, not a full day. Times follow the crash dates and hours recorded in FARS. We did not convert them to a single time zone.
Comparison windows. For each year, we used the identical hours at offsets of minus 14, minus seven, plus seven and plus 14 days. The four comparison windows were fixed before the principal timing analysis. We call them nearby comparison periods, not holiday free periods: four of the earlier windows contain Veterans Day. Excluding those windows and giving each year equal weight left the overnight ratio at 2.97.
Counting. A fatal crash is counted once by year and case identifier. Deaths are counted separately using the fatality field. A crash with multiple deaths remains one crash. The five holiday windows represent 510 clock hours, and the 20 comparison windows represent 2,040. For the highlighted Thursday block, the corresponding totals are 30 and 120 clock hours. Comparisons use averages per equal length period.
Missing time. One holiday crash, with one death, has an unknown hour. It is retained in the full period total but excluded from clock hour comparisons. No unknown hour crash occurred on a Wednesday boundary in the selected windows. We did not silently assign unknown hours to daytime or nighttime.
Limits. This is a descriptive review of a small number of years. It does not adjust for miles traveled, trip counts, traffic mix, weather or other changing conditions. The timing result was selected after examining 17 blocks, not tested as a single prediction in advance. We make no claim of statistical significance, causation, a safest route or a safest departure time. FARS revisions can change the results.
Sources and reuse
Original calculations: Texas Truck Accident Lawyer, November 2026. Researchers can inspect all annual windows, all six hour comparisons, the source file checksums and the calculation script. Charts should keep their source, date range and count versus risk note when reused. Government data remain attributed to their original publishers.
Official source collection: NHTSA FARS downloads. Exact annual ZIP addresses and hashes are included in the download manifest. TxDOT annual crash statistics archive. National Safety Council comparison method. NHTSA drowsy driving guidance. NHTSA Thanksgiving travel guidance. Current Texas road conditions.
Download the evidence
Aggregate data, exact source addresses and file checksums. No registration required.