
Original analysis · Texas only · 2022–2024
Most Dangerous Highways in Texas: What the Crash Data Shows
A road you recognize. A map you can use. The numbers behind the “deadliest highway” headlines.
I-35, including I-35E and I-35W, recorded 334 fatal crashes and 379 deaths—the highest fatal-crash count among the 291 matched numbered-highway groups in our analysis. I-10 followed with 297 fatal crashes, then I-45 with 214.
That answers a question about where fatal crashes accumulated, not which highway puts an individual driver at greatest risk. Longer, busier roads have more opportunities for crashes. These figures are not adjusted for traffic or mileage.
Is this a road you drive?
Find your highway
Choose a highway to see its reported fatal-crash locations, yearly totals and counties. Texas only · 2022–2024 · all vehicle types.
I-35
Includes I-35E and I-35W
334 fatal crashes · 379 deaths
333 of 334 included crashes mapped. City labels are geographic references, not hotspot labels.
Year by year
| Year | Fatal crashes | Deaths |
|---|---|---|
| 2022 | 113 | 125 |
| 2023 | 118 | 133 |
| 2024 | 103 | 121 |
Counties with the most recorded crashes
Within this highway group, not across all roads in each county.
| County | Fatal crashes | Deaths |
|---|---|---|
| Dallas | 68 | 75 |
| Travis | 38 | 40 |
| Bexar | 27 | 27 |
| Tarrant | 27 | 34 |
| Denton | 23 | 27 |
These are fatal-crash counts, not risk per trip. We group branch suffixes and use the primary road name reported in FARS. A road absent from these results is not necessarily safe. Read the inclusion rules.
The statewide comparison
Which Texas highways had the most fatal crashes?
These ten groups had the largest counts in the matched records. A fatal crash is an event; deaths count the people who died. One crash can kill more than one person.
| Highway group | Fatal crashes | Deaths | County with most matched crashes |
|---|---|---|---|
| I-35Includes I-35E and I-35W | 334 | 379 | Dallas (68) |
| I-10 | 297 | 332 | Harris (74) |
| I-45 | 214 | 229 | Harris (93) |
| I-20 | 205 | 230 | Dallas (32) |
| US-90 | 129 | 150 | Bexar (33) |
| I-30 | 117 | 133 | Dallas (57) |
| US-59 | 112 | 130 | Nacogdoches (13) |
| US-287 | 110 | 144 | Tarrant (20) |
| US-67 | 93 | 108 | Dallas (11) |
| US-281 | 89 | 106 | Bexar (18) |
Source: our analysis of NHTSA FARS downloads retrieved September 18, 2026. Primary named highway only; specified access roads and ramps excluded. The county column is within each highway group, not a county-wide ranking. Full method and coverage.
What this means for roads you actually drive
The most useful question is not simply “Which road is number one?” It is whether the comparison describes your highway, the part of Texas you use, and the type of crash being counted. Use the selector to find your route, then check the county and annual tables beside its map. A point on the map marks a reported historical crash location; it does not establish that the junction is a statistically unusual hotspot.
I-35: one total, including two familiar branches
The 334-crash figure combines the parent I-35 label with its branches, including I-35E and I-35W. It should not be read as a count for I-35E alone, I-35W alone, or just the Austin stretch. Dallas County accounts for 68 included crashes; Travis County accounts for 38. The county breakdown is a starting point for locating the records, not a claim that every mile in that county has equal risk.
The yearly totals were 113 in 2022, 118 in 2023 and 103 in 2024. Keeping the years visible prevents one year's movement from being mistaken for a steady trend—or a prediction about your next drive.
I-10: separate a statewide corridor from a Houston commute
I-10 recorded 297 included fatal crashes and 332 deaths across its Texas records. Harris County had 74 of those crashes, while El Paso County had 44. The full Texas total is not a Houston-only figure, and neither county total describes one interchange. It also excludes I-10 crashes in other states.
I-45: a large count is not the same as the highest rate
Our I-45 group contains 214 fatal crashes and 229 deaths. Of those crashes, 93 were recorded in Harris County. I-45 is behind I-35 and I-10 on this particular count measure; that does not disprove a study using another period, deaths per road mile, or different road boundaries. Those are different comparisons.
If you are researching an actual truck collision rather than planning a journey, our Houston I-45 truck-accident guide addresses the separate legal questions. These research totals include all vehicle types and must not be presented as truck-crash figures.
I-20 and U.S. highways deserve attention too
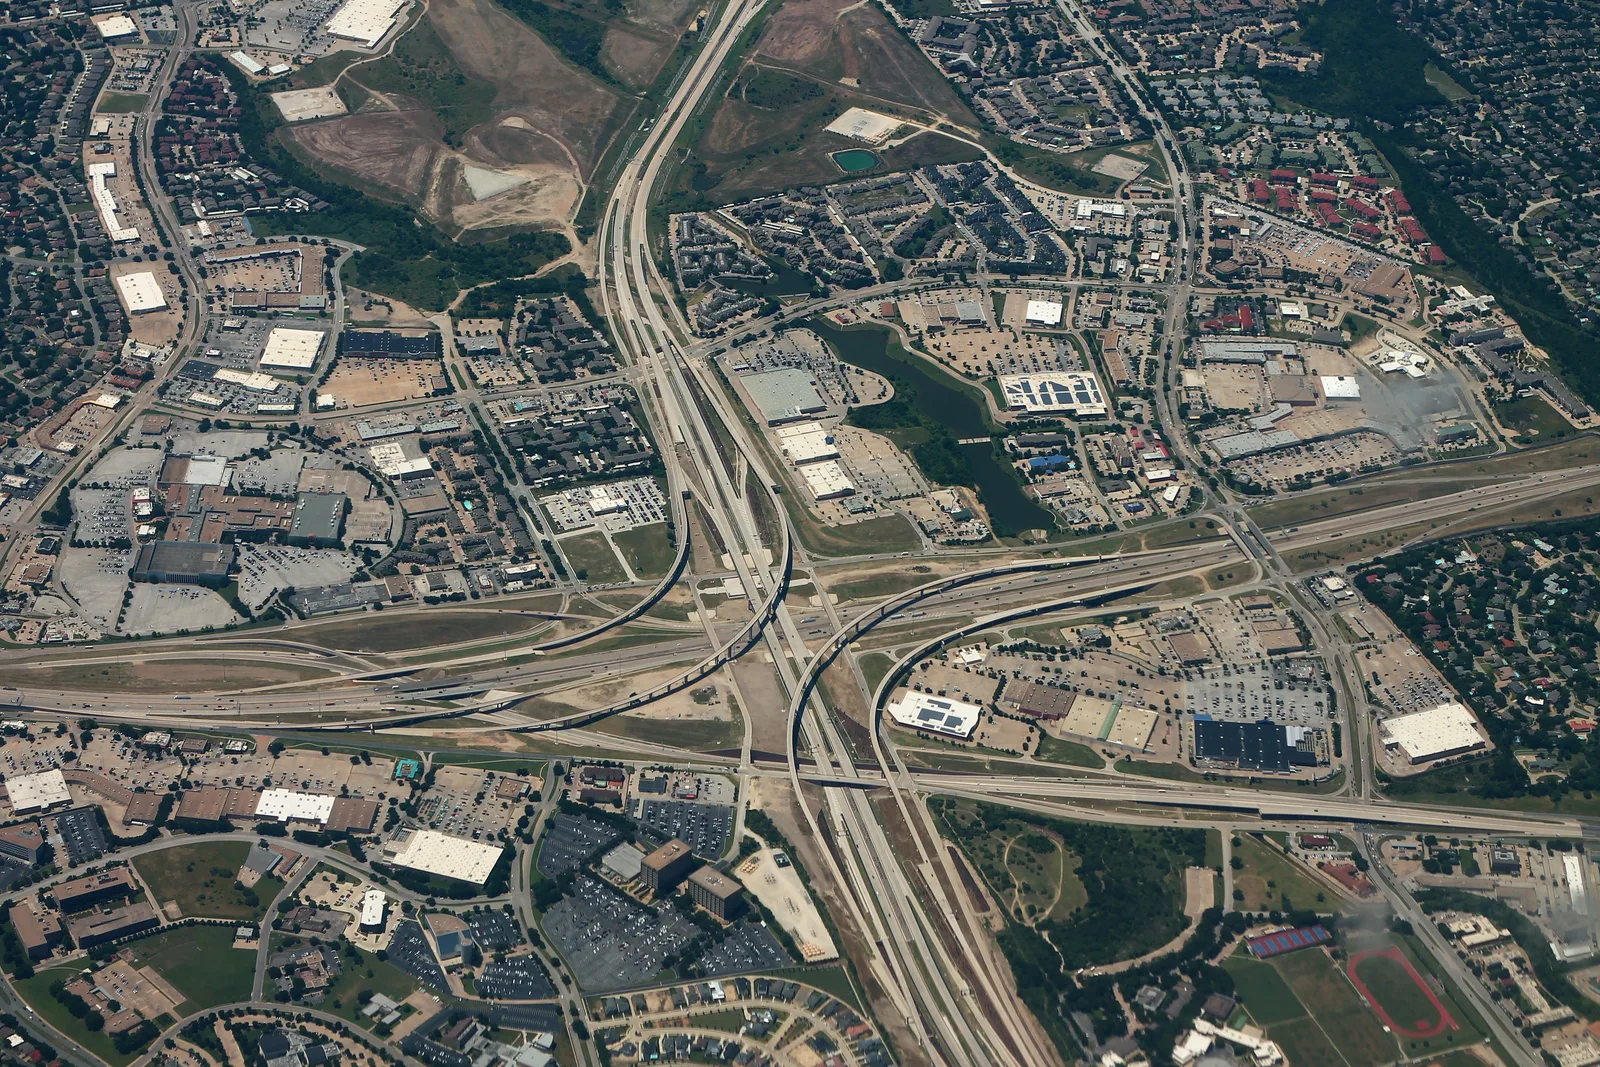
I-20 recorded 205 included fatal crashes. Dallas and Tarrant counties accounted for 32 and 28, respectively. The comparison is not limited to interstates: US-90 appears with 129 crashes, US-59 with 112, and US-287 with 110. Search your numbered route even if it does not appear in the top ten.
.jpg)
Why a “most dangerous road” list can mislead
A long road carrying many vehicles can accumulate more crashes than a shorter, quieter road even if a typical trip is less risky. Deaths per road mile adjust for distance but still do not account for how much traffic uses the road. A traffic-adjusted comparison would need consistent vehicle-miles traveled and matching roadway boundaries. This analysis does not have those denominators.
There are other important boundaries. These are fatal crashes, not every collision or every serious injury. The source includes people walking and other road users as well as people inside vehicles. It does not tell us that the roadway caused a crash, that a truck driver was responsible, or that switching to a road with fewer recorded crashes would make a journey safer.
A route missing from the results may be recorded under a local name, fall outside our selected road systems, or have no included record during the window. “Not listed” does not mean “safe.”
Before your next drive: check conditions, not just history
This map cannot tell you about today's flooding, lane closures, congestion or work zones. Check DriveTexas before departure for current reported highway conditions. Do not operate the map or look up crash records while driving. Use the historical analysis for research and context—not turn-by-turn navigation or a promise about the safety of an alternative route.
For a different question—how commercial-motor-vehicle crashes compare across counties—see our Texas truck-accident statistics by county. Its scope is different and its totals should not be combined with this all-vehicle fatal-crash analysis. If you need documents after a specific collision, start with how to obtain a Texas crash report.
Open methodology
How we counted the crashes
We downloaded the national 2022, 2023 and 2024 NHTSA Fatality Analysis Reporting System (FARS) CSV files on September 18, 2026. NHTSA's FARS definition requires a motor vehicle traveling on a trafficway customarily open to the public and a vehicle occupant or nonoccupant dying within 30 days. These are dated source downloads; we do not claim that 2024 is final or that it is the newest obtainable year.
- Select Texas. Filter the crash-level accident table to STATE=48 and validate unique year-plus-case identifiers. That yields 11,617 Texas fatal-crash records.
- Match the primary numbered highway. Require coded Interstate, U.S. or state highway systems and a matching I-, US- or SR- number at the start of TWAY_ID. We display SR as SH. Secondary-road field TWAY_ID2 never adds a second count. Concurrent roads stay under the primary source name.
- Group branches; exclude specified access roads. Lettered and directional suffixes collapse to the parent number, including I-35E/W and I-69's branches. Explicit ramp, frontage, service, business, connector and spur names—including BU and SV abbreviations—and coded entrance/exit ramp locations are excluded. This is source-name classification, not an independent reconstruction of every mainline and frontage road.
- Reconcile the exclusions. 5,579 records fall outside the selected systems; 535 meet the access-road/ramp exclusions; 10 have unmatched names. The remaining 5,493 fatal crashes form 291 groups. All records and decisions are in the audit download.
- Keep counts separate from mapping. Seven included crashes lack usable coordinates. They remain in the totals but not the map. County/year values use all included records. The outline and reference cities come from 2024 U.S. Census geographic files.
We preserve source names rather than guessing corrections. Small county/year counts should be interpreted cautiously. FARS and Texas CRIS totals can differ because of definitions, reporting timing and revisions; the datasets are not interchangeable.
Original national files: 2022 FARS ZIP · 2023 FARS ZIP · 2024 FARS ZIP. Geographic sources and file hashes are in the source manifest.
For readers, reporters and researchers
Download the evidence
No signup required. Check the figures, examine an excluded road name, or reproduce the analysis from the original government files.
Suggested citation
Texas Truck Accident Lawyer, “Most Dangerous Highways in Texas: What the Crash Data Shows.” Analysis of NHTSA FARS 2022–2024 downloads retrieved September 18, 2026. Cite the three-year window and the route-family scope—not just “most dangerous.”
Questions about this analysis or a specific truck collision? Contact Texas Truck Accident Lawyer.